Trajectory and Time-Series Vertical Section
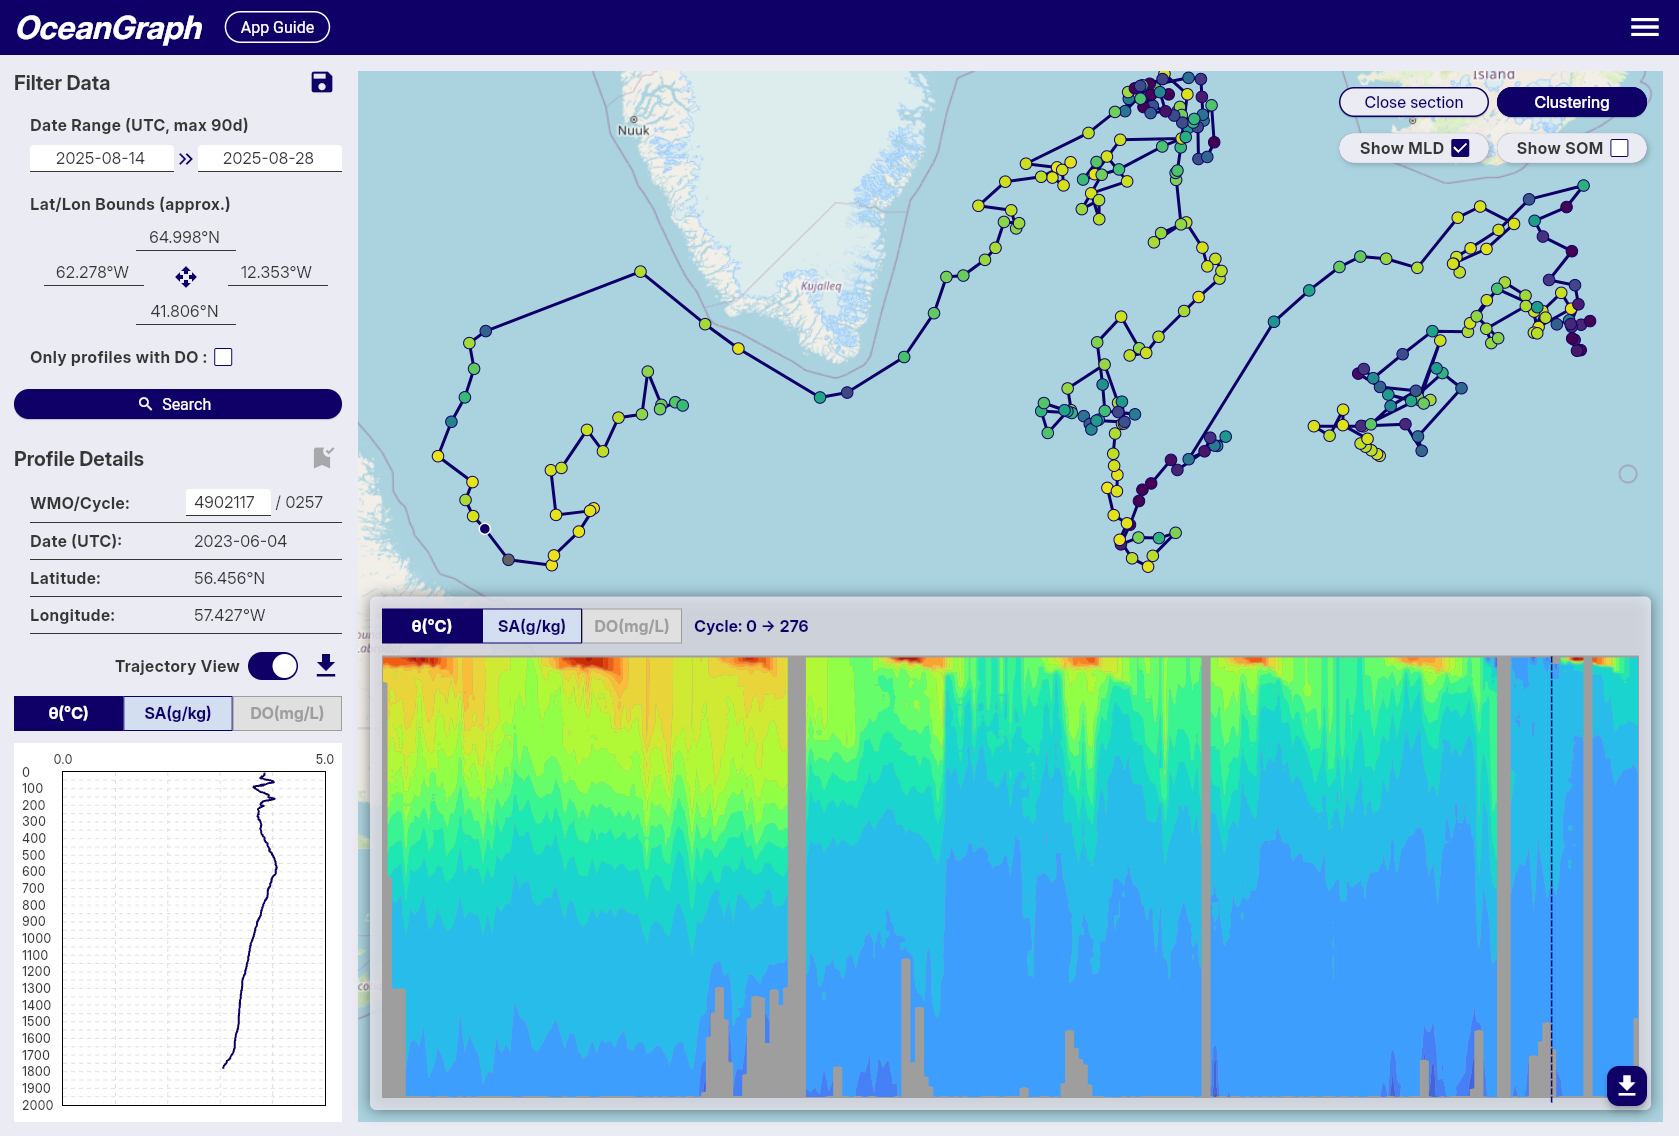
This feature allows you to visualize Argo float data as a time-series vertical section, showing how oceanographic parameters change with depth and time along the float’s trajectory. The vertical section provides a comprehensive view of the water column structure throughout the float’s journey.

Accessing Time-Series Vertical Sections
To access time-series vertical sections of Argo float data, follow these steps:
- Select a Float: Start by selecting an Argo float from the search results or the map view.
- Turn on Trajectory mode: Turn on the “Trajectory Mode” button to display the vertical section view.
- Show vertical section: Click on the “View Section” button to view the time-series data for the selected float.
Tips
- The vertical section is linked with the vertical profiles in Profile Details, and the position of the selected profile is shown with a dashed line.
- Missing data areas indicate locations where data did not pass quality control (QC).