Limitations
Missing Values in Vertical Section Charts
-
Masked Areas Without Original Data
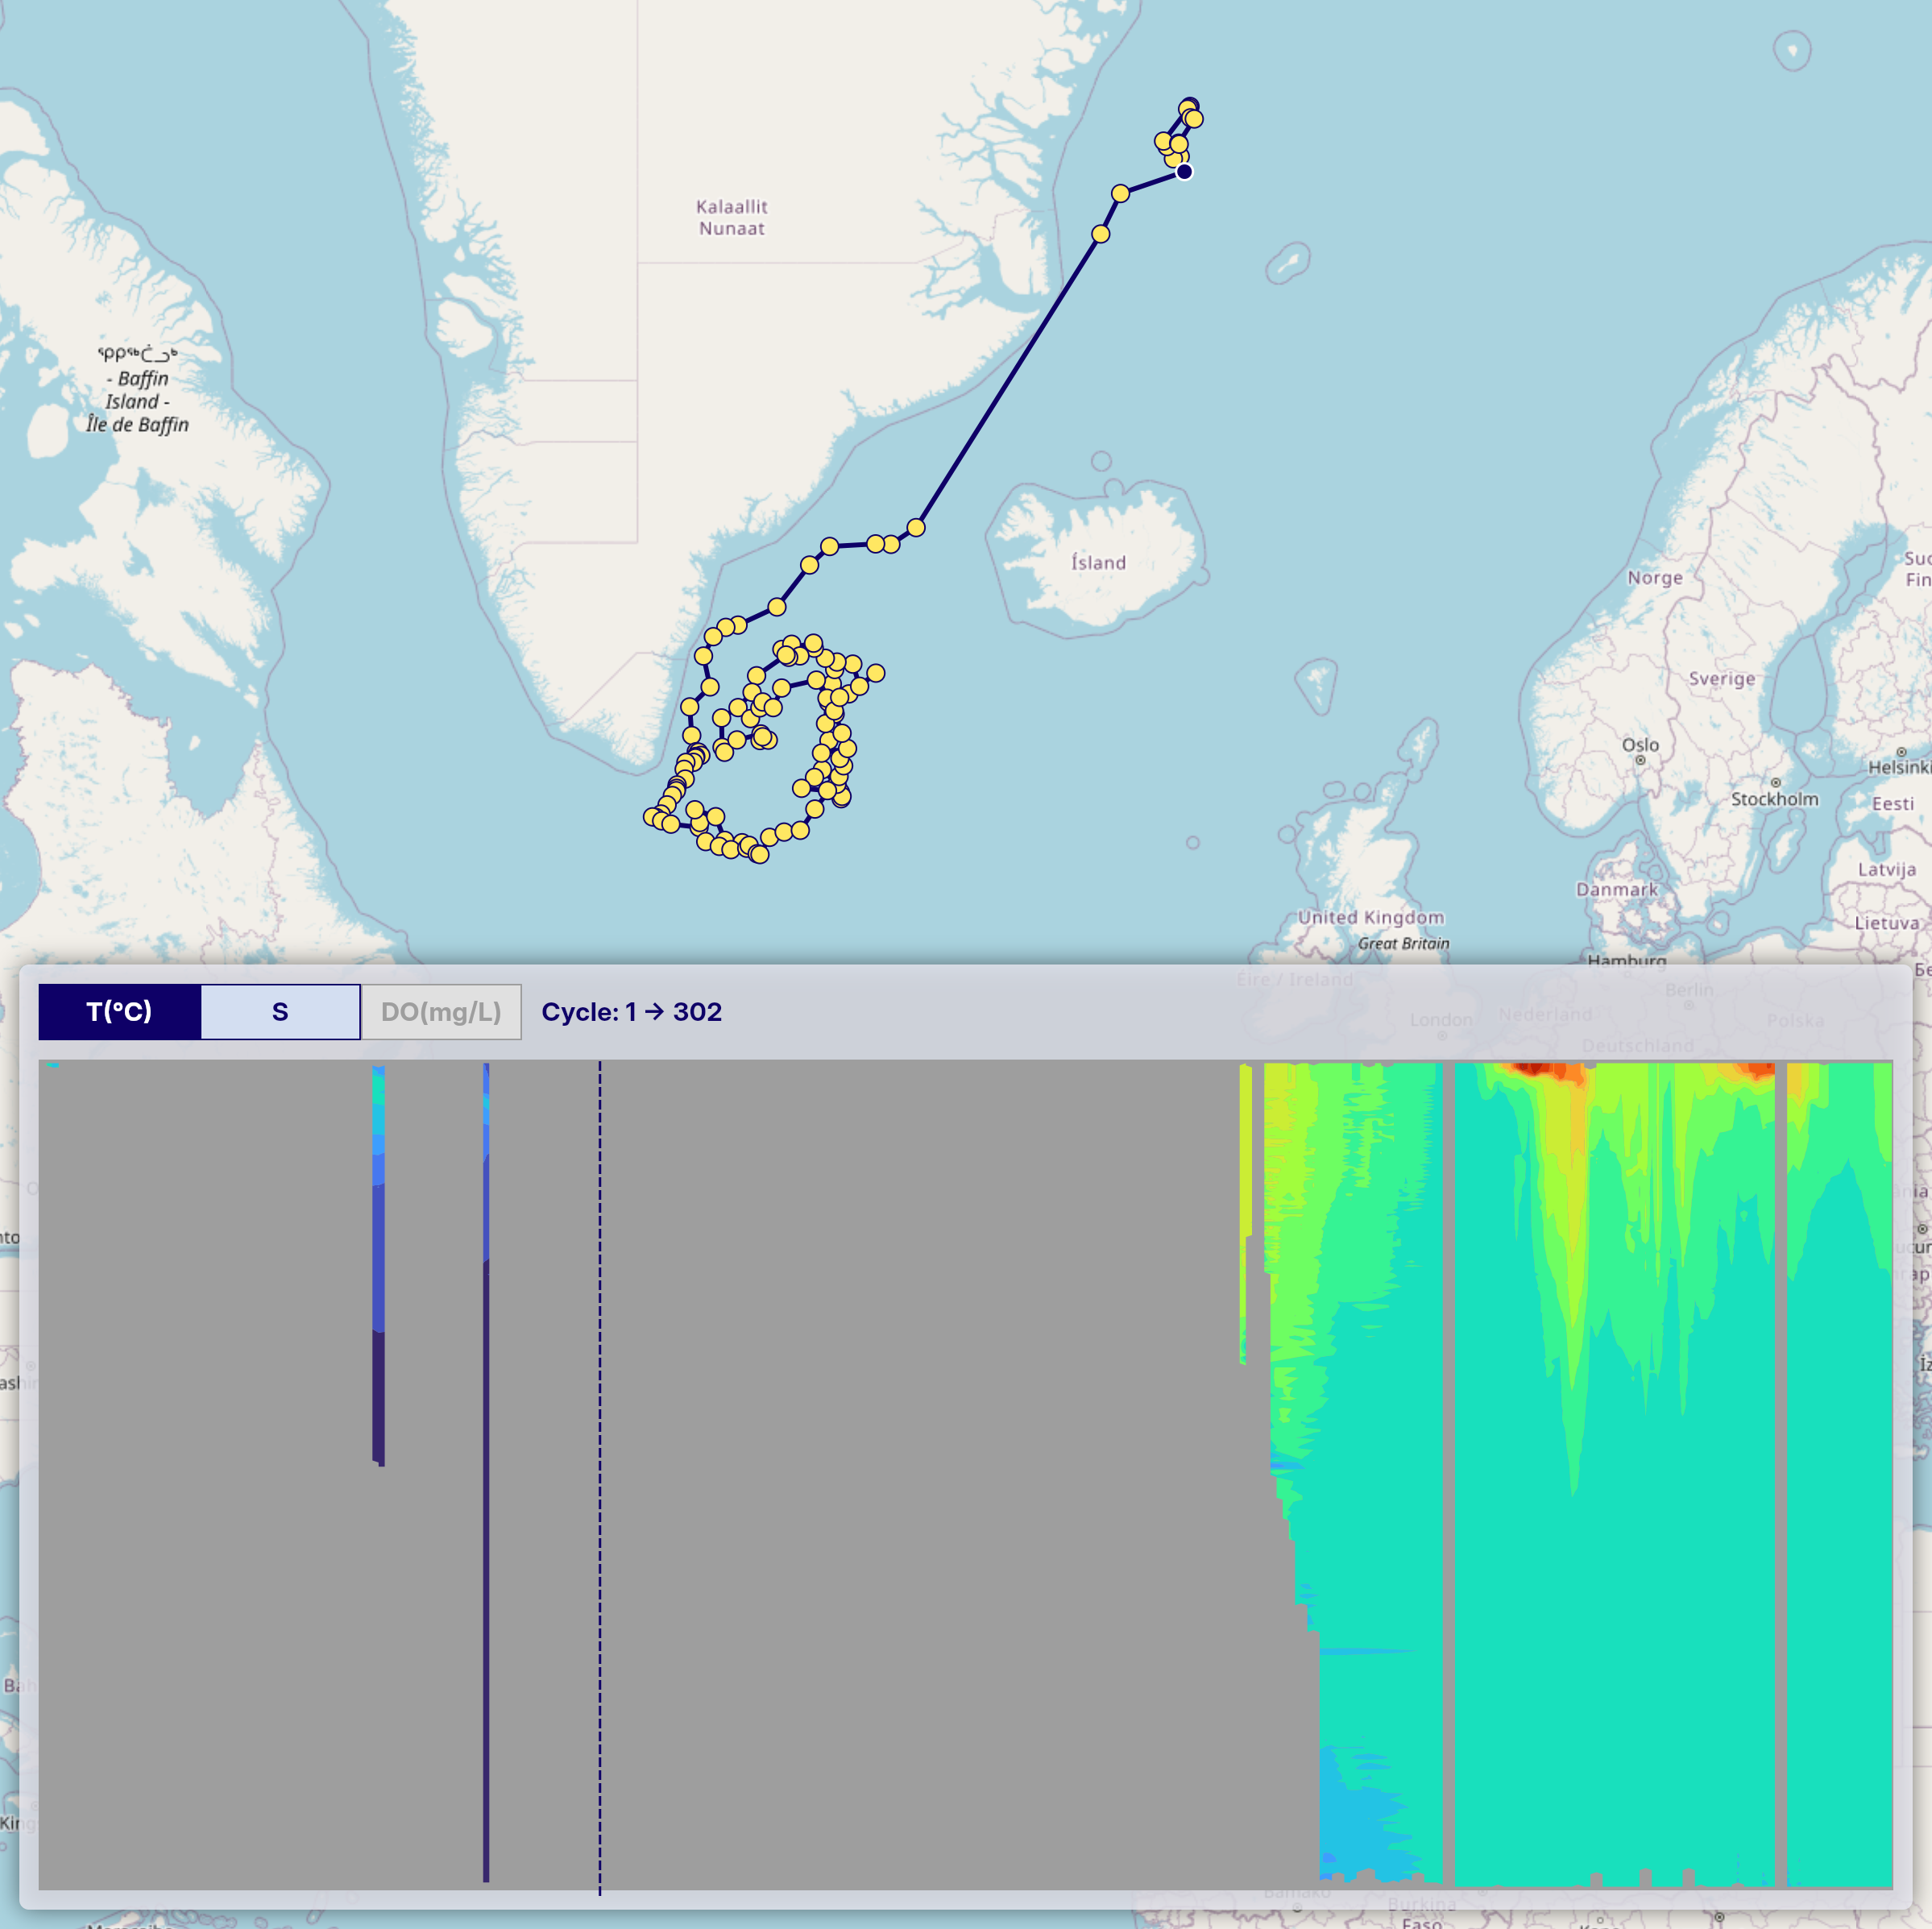
When generating time-series vertical section charts of Argo float data, interpolation (e.g., using scipy.interpolate.griddata) is used to transform irregularly spaced profile data into a regular grid. Some areas may remain unfilled where original profile data are missing. To address this, we apply a mask after gridding to exclude regions without valid observations, setting those values to NaN.
In the example image below, these masked areas appear as uncolored gaps in the vertical section.
-
Sparse Data Due to Quality Control
After applying quality control, some profiles may be excluded, resulting in a sparser time series. Even if valid profiles are present at certain time steps, the interpolation process may not be able to generate a continuous vertical section. This leads to sections where observation points exist (trajectory figure) but the interpolated chart shows gray or missing areas (vertical section figure), indicating insufficient data density for interpolation.
This can be seen in the same image where gray regions appear in the section chart, even though observation points are visible in the trajectory chart above.

Please keep this in mind when interpreting the charts.